King County and Seattle Took Biggest Share of Housing Trust Funds from 2008-2016
I fell down a rabbit hole of data this past weekend, digging around 8 years of Housing Trust Fund (HTF) data. While the HTF doesn’t fund all non-profit affordable housing in Washington or Seattle, it forms an important part of the funding mix. The data I was working with was an Excel worksheet with all the projects that received funding between 2008 and 2016. I spent time breaking the data down by county and looking at overall distribution.
Here’s what I created using the raw data:
Now one thing before I give some key points I pulled from this is that housing takes a long time to build. The one 43 unit project I worked on took five years from design and budgeting to a completed project with people in it. That’s actually pretty fast. And it took two runs at the HTF process before the project got funding from the HTF. Often these projects can take a decade to put together from concept to certificate of occupancy. Seattle’s Mandatory Inclusionary Zoning (MIZ) ambitions are pretty fanciful in this regard. Even when the Office of Housing says, as they did in 2016, that they funded 610 units of housing, it doesn’t mean that housing went on line that year, the next or even this year. Trying to tie up land, get financing completed — especially from multiple sources of funding — completing construction on time and on budget is a huge challenge.
Housing is very difficult to build and operate. I’m even more convinced now when I see these numbers that there simply isn’t anyway that subsidized non-profit housing in Seattle is going to meet demand no matter how it is defined. Land is increasingly hard to get, costs are going up, and the Mandatory Housing Affordability (MHA) scheme is fanciful in it’s production goals, assuming something like 800 per year between now and 2025. Here’s another thing, most projects are not funded based on the need they are meeting but based on how much capitol the project has assembled. This is especially true of the HTF which pushes out resources to projects based on whether there is a project that is ready. Poorer areas of the state simply don’t have the existing resources to wade into the competition, so they get less funding overall. I tried to look at income and population. It is true that King County has a lot of people, but other parts of the state face similar challenges but with less resources.
I’m a long way from being done reviewing this and other data related to housing funding. But what’s emerging for me is that helping people who are facing housing challenges is best done with cash, not capital expenditures. Here’s why: a person who is cost burdened is by definition already housed and paying rent, just too much rent. If we simply covered a reasonable percentage of rent so that households were paying 30 percent of their income or close to it, we could solve most of the problem and very fast. Building housing is very expensive and getting more so and takes a long, long time. Most people looking at not being able to cover rent next month or the next will never be helped by MHA or HTF. It’s too little too late.
Here’s a quick bunch of thoughts about the data I messed around with.
- The Commerce Department measures unit costs by taking the total development costs and dividing by the number of units. I’ve blasted again, and again for this, but that’s how it’s done!
- If non-profit people had bothered to take the time to look at the data, they’d been able to respond to my criticism of some projects by pointing out that for HTF projects anyway, the average unit costs is closer to $250,000.
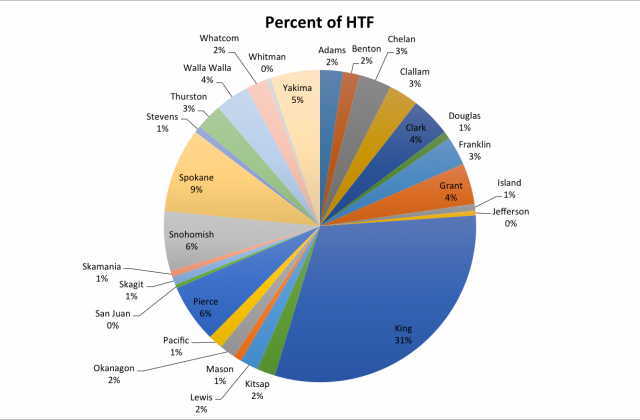
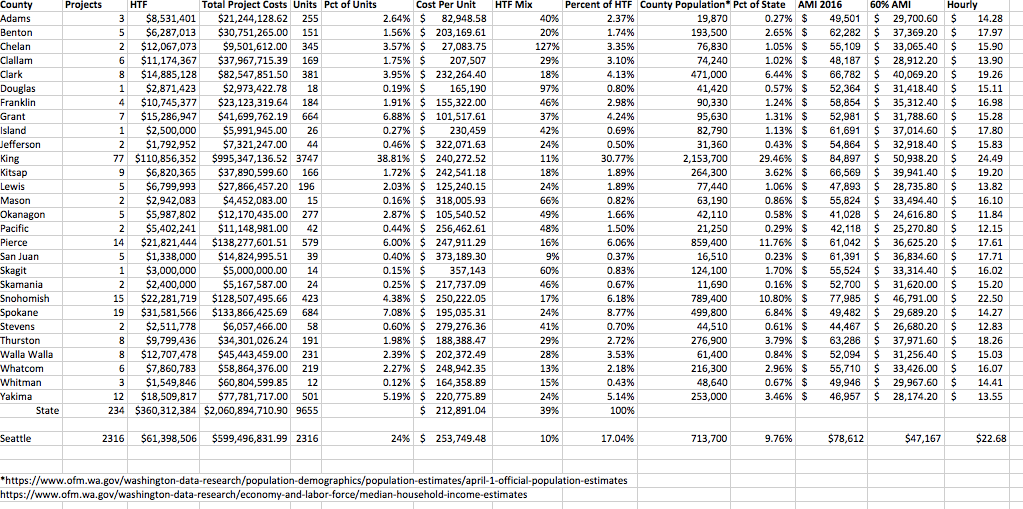
- The Housing Trust Fund contributed to the production of 234 projects and a total of 9655 units between 2008 and 2016
- King County received about 31 percent of the total HTF over the period and produced about 39 percent of the total units in the state.
- King County has an Area Median Income (AMI) of $84,897, and a qualifying income for housing subsidies of $50,938.
- Seattle received about 17 percent of the total HTF over the period and produced about 24 percent of the total units in the state.
- Seattle has an AMI of $78,612 and a qualifying income for housing subsidies of $47,167
- Seattle produced about 290 units with HTF per year over the 8 year period.
- The assumptions of the MHA program are a production rate of about 833 units per year (5000 units over about 6 years, 2019 to 2025). They’ll never make this goal producing 290 units or even twice that.
- Per unit costs for Seattle units rose from an average of $224,944 to $321,801 by 2016, a 43 percent increase. Inflation over the same period was about 11 percent. The reason Capitol Hill Arts and El Centro’s project are so expensive is that costs are “skyrocketing.”
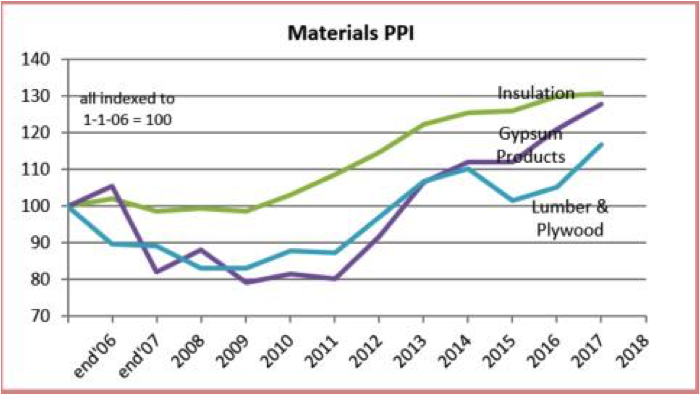
- The Producer Price Index, a measure of things like lumber and steel products used for building is rising dramatically and has been since 2008.
- The nine poorest counties, with qualifying incomes of less than $15 per hour got about 25 percent of the HTF allocation over the period and about 22.7 percent of the units
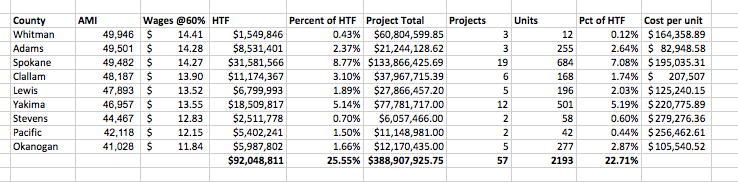
Again, these counties have a lot less people than the larger counties. But these are the counties with some of the greatest poverty and housing challenges but very little capital to leverage for HTF resources or tax credits. Meanwhile, the City of Seattle is making worse and worse housing policies which is making the ratio between income and housing costs worse. If prices for land, materials, and labor keep rising, more rules and regulations and fees proliferate, Seattle’s share of HTF is likely to rise. While HTF funds were highly leveraged by Seattle (their mix of HTF funds was only 10 percent of total project cost) that’s yet another indication that maybe they don’t need HTF.