Mike Scott: Can You Handle The Truth About Apartment Rents?
The average apartment rent in Seattle rose 8.3% in the past year. That’s a lot. No doubt about it. It beats inflation. It beats wage growth. So some in the media and special interest groups take to calling this a problem of skyrocketing rents, a crisis, an emergency. Is it really? Let’s take a look.
First, let me say this about that. That type of hyperbole is misleading at best. And it is dishonest at worst.
Next, that 8.3% rent increase compares rents last year with rents this year. That’s fine, except for one thing. Developers opened a lot of new apartments in the past year. And new units have more features and rent for more. So it is really an apples-to-oranges comparison.
So you should exclude the new units to make an apples-to-apples comparison. We did that, and found rents rose 7.5%. That’s still a lot, but at least this correction makes the data more meaningful and more honest.
Next, we need to look at rent trends over time. And we will back out the distortion created by new construction. A snapshot does tell “a” story. But it does not tell “the” story, the whole story.
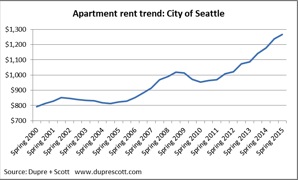
The average rent in Seattle in 2000 was $792. Over the past 15 years it has increased to $1,266. But you can see that over those 15 years rents rose faster in some years, slower in others, and even fell sometimes. Rents are impacted by a lot of things, like the economy and how much competition there is from new supply, to name just two.
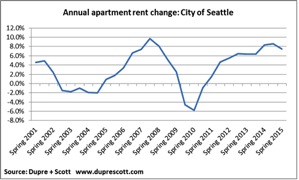
Instead of looking at the rent dollars each year, let’s look at the change in rents every 12 months. You can see how cyclical rents are. And you can see that recent increases, while significant, are not unusual. And this roller coaster trend didn’t just suddenly appear 15 years ago.
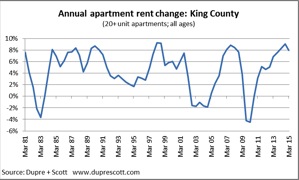
Here’s a look back over almost 40 years. This is for all of King County and we didn’t filter out the distortion from new construction. Why not? Lazy I guess. We have quick access to this information on the county level. Breaking out Seattle would be pretty time consuming. Anyway, it is still useful. And it shows the same trend over and over and over again.
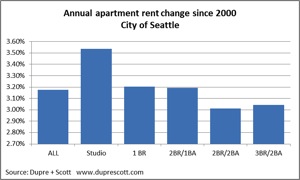
Getting back to Seattle, the overall rent trend we started this discussion with is similar for each unit type, from studios to 3 bedroom apartments.
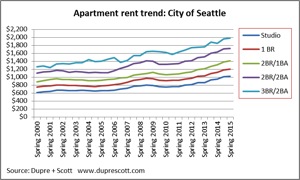
The bottom line: Over the past 15 years rents rose just under 3.2% a year in Seattle. They rose a little more in studios and less in 2 and 3 bedroom apartments.
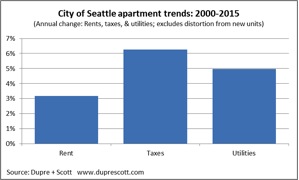
To put those increases in perspective, apartment investors saw real estate taxes increase 6.3% a year in the same period. And building utilities rose 5% a year. That’s important because those are the two biggest operating costs investors face. They account for 45% of total operating costs.
Don’t get us wrong. We do have a crisis. But it is not a crisis of skyrocketing rents. It is a crisis of skyrocketing hyperbole. It is a crisis of disinformation, which leads to bad decisions. How unfortunate for the entire community.