Supply and Demand Clock: What Time is it?
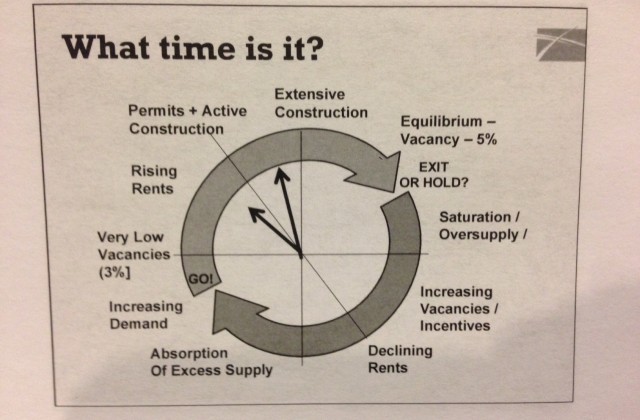
I am presenting at a Continuing Legal Education Seminar hosted by The Seminar Group today. The chair of the seminar is Blaine Weber from Weber Thompson Architects. He kicked off the seminar with one of the best charts illustrating supply and demand I’ve ever seen. It’s the featured image above, but here it is again:
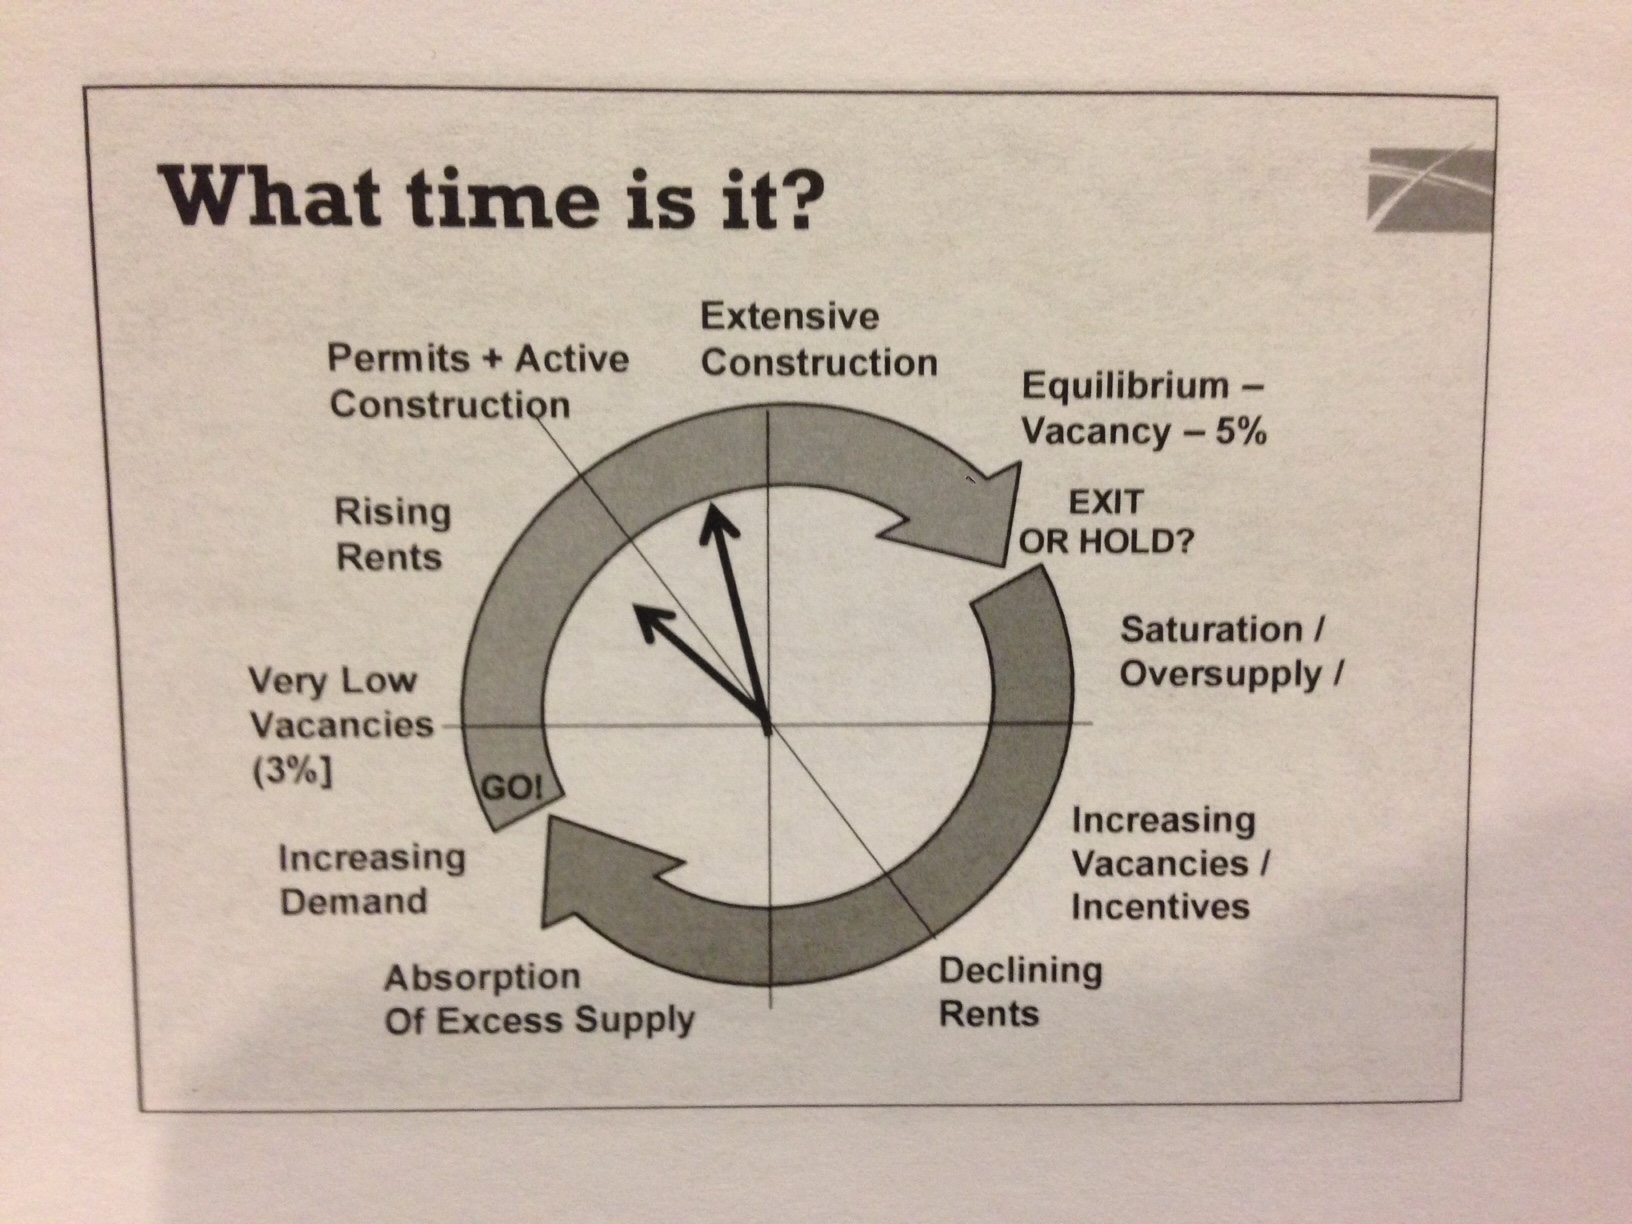
This is really how it works. The people in this seminar make decisions about money, lots of money, based on this cycle. That’s why they’re here, to help their customers and clients make decisions about the future of development in the city of Seattle and our region. Weber says it’s about 10 o’clock on the supply and demand clock. You can see what happens next; equilibrium, saturation, vacancies, and then declining rents.
Supply and demand is a real thing taken for granted by people who build. Policy makers regard it as something of a novelty, and some, like Counclmember Sally Clark, actually think this idea, supply and demand, doesn’t apply to housing:
“The argument is that if there are enough cans of Pepsi, the price of Pepsi will come down,” Clark says. “It may work for Pepsi, but not for housing.” She and others point to Ballard as an example of the failed maximum-density theory, where rental rates (and vacancies) are at a citywide high despite increased supply.
One doesn’t need to look too much more for a reason why our city leaders can’t figure out how to solve the housing problem. They need to figure out what time it is: it’s time to build more housing!