Tale of Two Maps: Seattle Mayor and Council Draw New Redline
Posted by Roger Valdez on Wednesday, October 26, 2016 · Leave a Comment
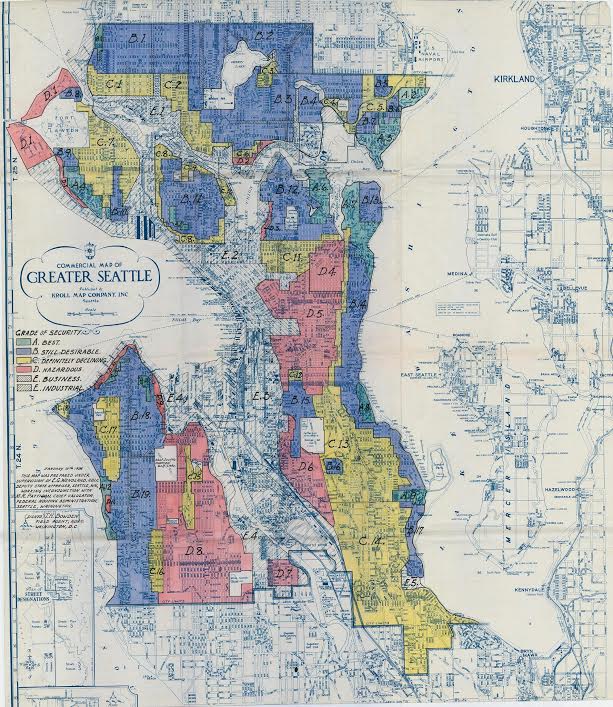
National Geographic has a very interesting post called, “Newly Released Maps Show How Housing Discrimination Happened.” The post highlights a project called Mapping Inequality led by Nathan Connolly, an urban historian at Johns Hopkins University and others at the National Archives that digitized maps made by the Home Owners’ Loan Corporation known as HOLC.
The HOLC was tasked with figuring out the investment risks in various cities so banks could determine where to give out loans. To do this, the organization often relied on local real estate agents and lenders, who, in many cases, judged neighborhoods based largely on their racial and socioeconomic makeup. Less affluent neighborhoods and those with significant minority and foreign-born populations got lower ratings and were colored red on the maps, a practice that came to be known as “redlining.”
One of the featured maps is of Seattle, highlighting areas considered “Hazardous” in red and others considered “Best” in green.
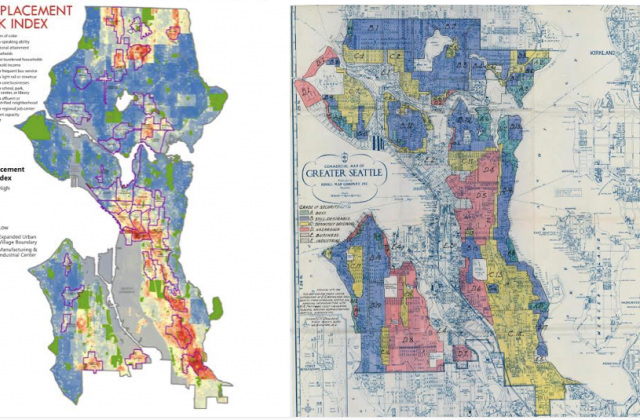
Interesting. Reminds me of another map that also had areas marked in red but also in blue.
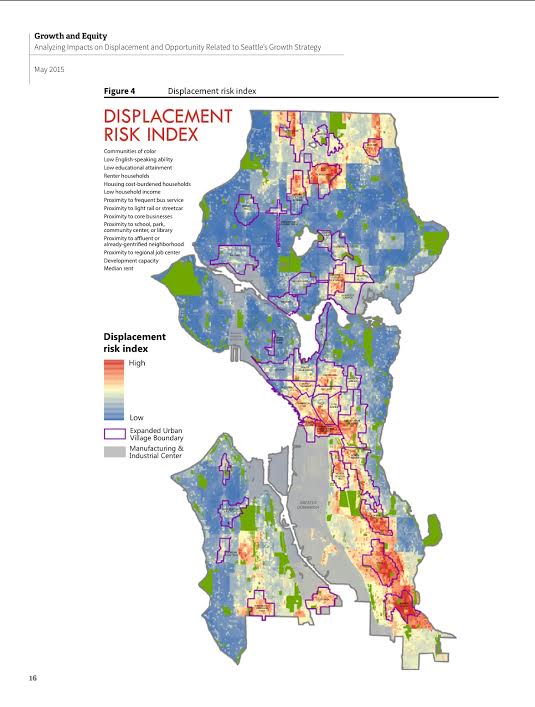
This is the City of Seattle’s Displacement risk heat map. Here’s what the City says about how they put together the map in a document called, “Growth and Equity: Analyzing Impacts on Displacement and Opportunity Related to Seattle’s Growth Strategy
The displacement risk index identifies areas of Seattle where displacement of marginalized populations is more likely to occur. The access to opportunity index identifies disparities in marginalized populations’ access to some key determinants of well-being.
Table 2 and Table 3 on the following pages describe the data used in the indices. The maps that follow illustrate the variation in displacement risk and access to opportunity across the city.
I didn’t include Table 2 and 3 but you can see them in the document linked above. The purpose of the map is to overlay lots of indicators to figure out where there is a concentration of lots of people of color, immigrants, people that don’t speak English, and people with low educational attainment and low incomes. Sound familiar.
Councilmember Herbold and O’Brien
pushed to add higher development fees for anyone investing in new housing construction in these areas. Now the Mayor
has gone a long with this notion adding it to the latest version of his so called Grand Bargain. The notion is that new housing will destroy these neighborhoods by forcing the people living there out. The best thing we can do, according to the Mayor and Council, is discourage investment in those areas. It would be better if they were just left alone. This is accomplished by sending clear economic signals — penalties essentially — for trying to buy land and build more housing in these neighborhoods.
So if that maps look similar and the idea is similar it’s not surprising: it’s the same thing, redlining. In the name of compassion I guess, the Mayor and Council have taken areas that are already hard to persuade investment in because rents are so low (not enough to cover the costs of building larger multifamily projects) and made them even more onerous, just like the HOLC did many decades ago. What was the result of the HOLC’s action? Well, it’s not completely clear that the HOLC maps caused segregation since they were descriptive. But when it came to lending money, banks did use them prescriptively do discourage investment in areas in red, the same thing The Mayor and Council are doing.
Of all the many ridiculous and destructive things coming out of the Mayor’s efforts to force feed the city his Mandatory Inclusionary Zoning scheme this one takes the cake. Try to build in a an area where there is a lot of diversity and the need for more economic opportunity and we’ll slap bigger fees on your efforts or mandate higher rates of inclusion. Clearly, this should be reversed. Part of the reason that not a lot of new housing–at any price–isn’t being built in the
supposedly high displacement risk areas is that there isn’t a lot of demand there currently. I suppose that’s the way the Mayor and Council want to keep things that way. I’ll give Connelly the final word from the National Geographic post:
“These residential decisions had decades-long consequences,” Connolly adds. “So much of the wealth inequality that exists in America is driven by inequality in real estate market and the ability to generate equity and pass it down from one generation to the next.”